
Overview of the Clear Flow Matrix Methodology
Background
As far back as its founding in 1988, Lott Brothers Construction Company has explored methods for improving construction project scheduling and control. The Clear Flow Matrix concept, now available to the construction industry through a software application, was born out of these efforts and, the Clear Flow Matrix organization was formed to bring it to market.
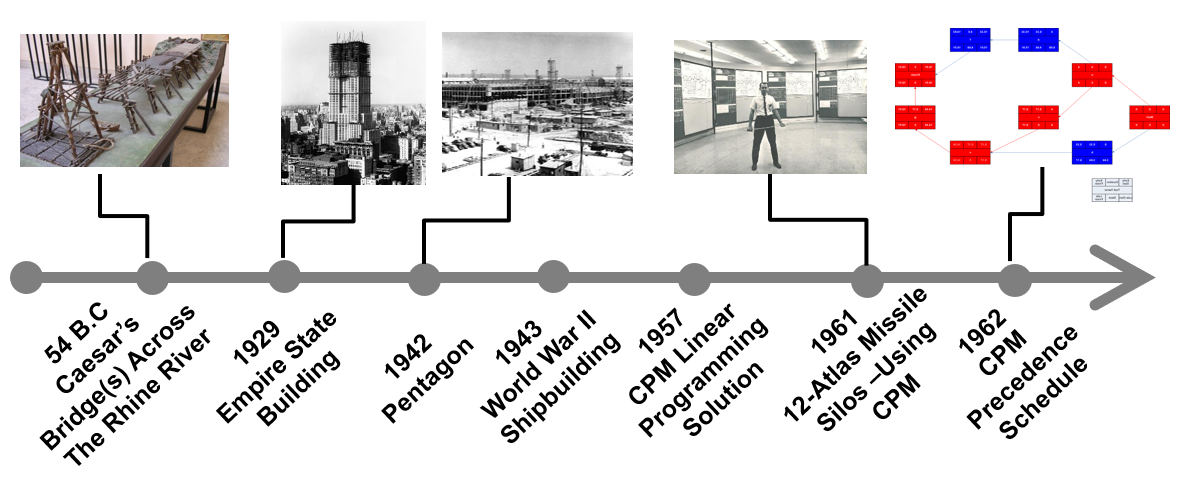
In the late 1980s and early 1990s, the company was faced with managing construction schedules and attendant production over a wide geographic area remotely from the home office. A straight-forward and visual tool for depicting production control supporting the project schedule was needed for the site supervisors in those remote projects. The Clear Flow Matrix was initially developed to provide a visual aid to the local superintendent to help manage the trades and control the required production of work required for the project while ensuring compliance with the Critical Path Method (CPM) master schedule established for the project.


How the Clear Flow Matrix Works
The Clear Flow Matrix production control method provides a clear visual and intuitive mechanism for managing and controlling the production of building works. This mechanism uses a simple two-dimensional matrix of work locations and trade work items with an embedded third dimension of time represented by the start date for each trade/location-area item.
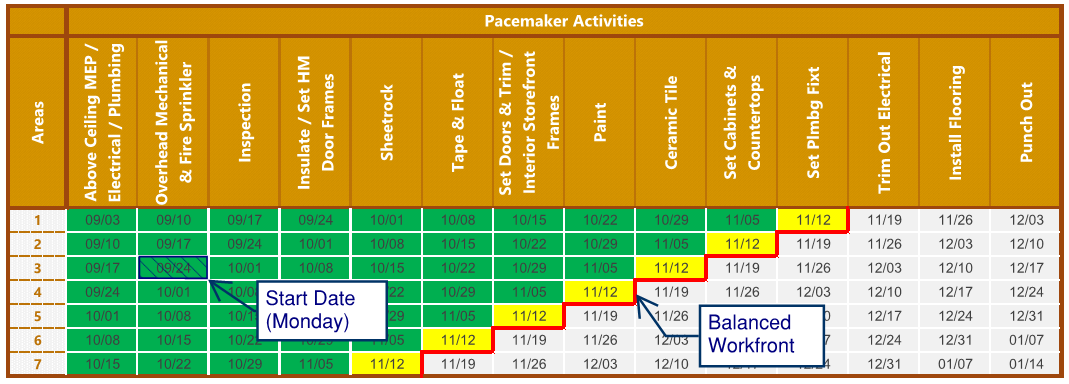
The first step in composing the Clear Flow Matrix is the identification of appropriate finish location-areas by carefully segmenting the entire project into smaller areas. These location-areas are listed in the first column of the Clear Flow Matrix as identifiers. The work items to be performed are identified in the first-row labels and are referred to as “Pacemaker Activities,”. The work of each trade within each of the location areas is to be completed in a period of one week with the starting date always on Monday. The Pacemaker Activities can be one single trade, or a combination of various trades and their order as placed in the matrix from left-to-right corresponds with the correct logical sequence of activities necessary to build the segmented location-areas. Thus, all work within each building area segment will follow the same sequence of work typically encountered in the installation of building finishes.
The functional cells in the Clear Flow Matrix are labeled with the scheduled start date of each of the indicated Pacemaker Activities for the area location segment, and therefore the duration and completion dates of the location-area work segments may also be determined from the matrix. The “diagonal line” formed by connecting cells with the same Monday date is referred to Balanced Production Front (BPF) and indicates a dateline that represents planned work for the indicated week. Figure below represents Clear Flow Matrix schedule and its terminology.
The Dynamic of the Clear Flow Matrix
During the construction progress of the project, this date line is referred to as the “Balanced Production Front” and it depicts the scheduled work status at the indicated date for the various area locations. As time and the project work advance, the Balanced Production Front moves forward with time and represents the work planned/completed for the status date in each CFMx cell. Any scheduled work that is incomplete and is behind the Balanced Workfront status date is considered to be late. All work activities that are underway but incomplete during the indicated week are marked with yellow and the activities already finished are marked in green. Late activities behind the Balanced Production Front are marked in red. In this way, clear and simple identification of late (behind schedule) work activities by location-area and the number of weeks that such activities are behind schedule are evident by visual review of the CFMx and the Balanced Production Front. Thus, the schedule update and progress review for each scheduled pacemaker work activity is binary; that is, scheduled work in the indicated location-area for the week is either complete or incomplete and therefore on schedule or late.
Updating the status of the matrix is accomplished by marking each cell of the matrix with colors according to the scheduled status of the cell in relation to the status date and the Balanced Production Front. Figures below show this schedule status and update dynamic of the matrix for the first three weeks of an example project in which the project started on Monday, September 9th. In the example, the first activity to be started on the project start date is “Electrical/Mechanical LV Rough-in.” Therefore, only the first cell must be marked with yellow indicating current progress has commenced. For the next week, Monday, September 23rd , the work represented by the first activity moves to the next area in the scheduled location-area sequence, and the next pacemaker activity, which is “Fire Sprinkler Rough In,” is initiated in the first location-area just completed by the first trade. The finished area from the previous week must be colored with green. In the third week of the project, the third pacemaker activity, “Plumbing Rough-In,” is started on the project and the precedent activities move forward to the next areas. This flow of Pacemaker Activities through the location-areas continues until the completion date of the project. Statusing construction progress is straightforward and is determined by examining the amount of work that is complete, incomplete or late by comparing completion status with the BPF. Bottlenecks and anticipated delay information may be obtained by counting cells of incomplete and late work that lag behind the scheduled BPF. For instance, assuming the project of figure below, the activities “Tape & Float and Interior Storefront Frames” are four weeks behind schedule, and the area 2 is four weeks delayed. In a similar fashion, is also possible to recognize activity acceleration.
Balanced Production Front
The Balanced Production Front depicts the optimal amount of work by trade and location-area required per production control period to just meet the as-planned master project schedule completion date without any disruption. Working at the pace of the Balanced Production Front, the project should not suffer any stoppage due to bottlenecks because all trades will have the same work in process and the same time to handoff their work, one production control period per location-area as shown in the cells of the matrix.
Therefore, all trades are working at the flow pace necessary to just deliver the planned client throughput and thus are avoiding bottlenecks.
In building construction projects, trade contractors tend to accelerate their schedule so that they can finish their job and move on to other contracts or to accelerate their as-planned payments from later billing periods to earlier ones. However, this often leads to a situation in which areas are not ready for them to start their work, requiring the subject trade to either wait for completion of the preceding trade or to move to some other location within the project to work ahead of another trade. Waiting is a typical example of waste in construction that can be avoided with balanced production management techniques, such as the CFMx. Trades working ahead of the Balanced Production Front are not adding value but are, instead, creating additional work in process that does not increase throughput nor shorten the schedule.
Workload and Manpower Histogram
Furthermore, the Clear Flow Matrix can represent the work loading, or Work in Process (WIP), throughout the course of the project. At the beginning of the project, only a single location-pacemaker activity is under construction. Each week, another location-area of construction is added to the construction effort until all areas are under construction and then total work load diminishes as areas are completed sequentially. This status is indicated along the Balanced Production Front or “diagonal dateline” that advances with time from the first pacemaker activity and first location-area through the last pacemaker activity and last area. The starting date of each location-pacemaker activity is indicated by the date in the cell along this “diagonal dateline” which again represents the Balanced Production Front for the indicated date.
The work undertaken along the Balanced Production Front is the amount of WIP that just delivers the completed project in accordance with the master project schedule, and therefore represents the critical WIP expressed as a function of schedule date. As time and completed work of the project advance, the number of current work locations (yellow cells) increases from a single location of work at the beginning of the project until work is underway in all location-areas. The actual peaking of WIP, stabilization of WIP and the decline in WIP depends upon the number of location-areas and pacemaker activities. The Balanced Production Front identifies the variation of workload through the duration of the project. Figure below illustrates three different situations.
The CFMx and its embedded tool, the Balanced Production Front, can be used to generate a manpower histogram for the project. Assuming the same matrix schedule, but with no dates presented, project managers from trade contractors can fill up the blank cells with information regarding manpower for each segmented location-area. See below three examples of manpower spreadsheets. The pictures represent the electrical, plumbing and mechanical trades manpower information. The numbers inside the cells are the quantities of workers needed for each area for that trade.
For those pacemaker activities that have more than one trade working, it is necessary to sum up manpower information from the various trades. For instance, the first activity in the example below contains the electrical and mechanical trades and the number of workers for that column has to be the sum of the workers from each of the trades. It can also be noted that manpower matrix is related to the CFMx schedule and project managers may access manpower information for any week of the project.


As demonstrated earlier, the BPF is a diagonal line of cells with the same date in the matrix. Using this same concept, the manpower of each week is the sum of the diagonal cells on the BPF or dateline for the indicated date. Figures below show two examples of how the manpower spreadsheet interacts with the CFMx schedule. In this example, the Balanced Production Front for the week of 10/21 indicates that 19 trade workers are involved during that week. Another example is shown for the date of the week of 01/13, where the project has 36 workers on the job site. Once the spreadsheet is completed with manpower information, the manpower histogram can be generated for the entire project.


Pacemaker Activites
The Clear Flow Matrix and Lean Construction
With the growing and on-going implementation of lean thinking and Toyota production concepts from the manufacturing industry into the construction industry, it became evident that the Clear Flow Matrix incorporates certain production control techniques that accomplish many of the tenets of Lean construction and Toyota production. Thus, Lott Brothers Construction Company transformed some of the Clear Flow Matrix language to better align with their client’s Lean Construction terminology to utilize the technique on Lean Construction projects undertaken by the company.
Clear Flow Matrix with Lean Terminology
With the reference of the Clear Flow Matrix presented here, a production plan which focuses on flow efficiency alone might produce a completed section of the building very effectively only if all the needed resources were available in that area. In other words, conducting the work of the trades in a purely flow-efficient manner or resource-efficient manner does not effectively produce the completed product for the client. The objective is then to develop and follow a production plan framework that balances flow efficiency and resource efficiency so that the client and construction team members are served in a balanced way.
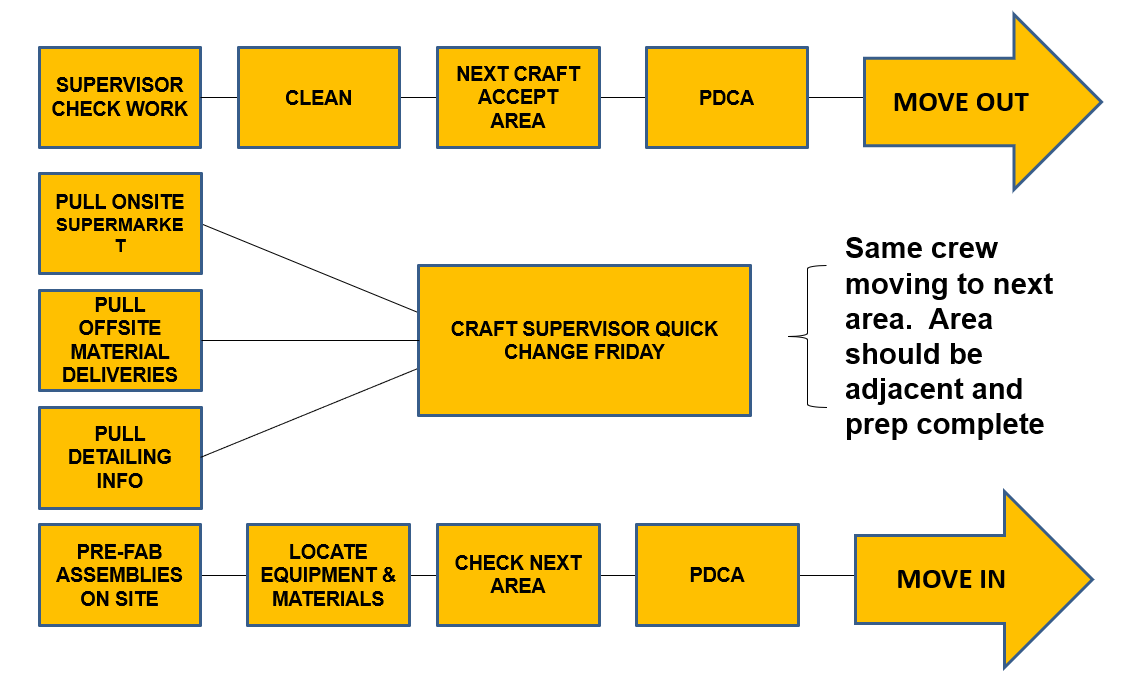
Handoff Process
Obtain the Complete Research and History
This page was adapted from the original thesis of the Clear Flow Matrix. You can download a copy of the complete body of work below.